
Info
The Info page provides an overview of the current status, system load, installed components, and software versions of the flexAI system.
The page is organized into five sections:
-
System Status
-
Hardware Status
-
Software Status
-
System Load
-
About
System Status
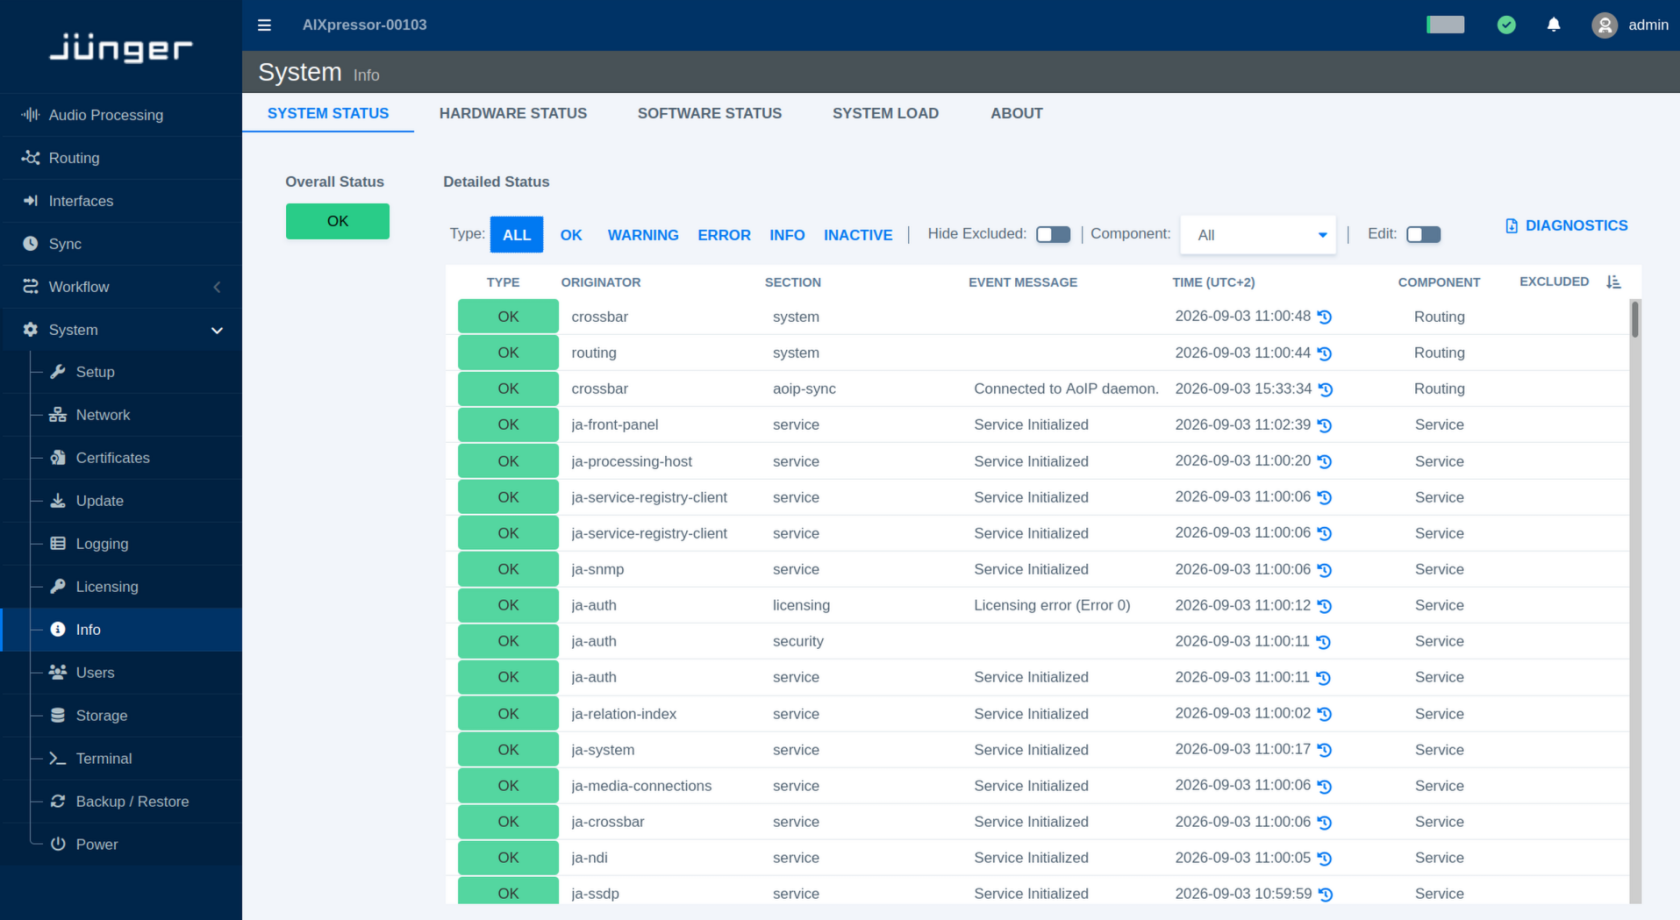
Select Info from the System menu to open the Info page. The System Status section is displayed by default.
The Overall Status indicator shows the general operational state of the flexAI system. A green OK status indicates that the system is operating normally overall. Individual components may still report informational messages, inactive states, or non-critical warnings.
The Component drop-down menu allows you to filter the status information by component group. Available groups include All, Service, System, Hardware, Audio Processing, Routing, Sync, Network, and Interfaces.
Use Edit to customize how individual status entries are handled. A status can be excluded from the calculation of the Overall Status, so that changes to this status no longer affect the general system status indication. Status entries that are not relevant for a particular installation can also be hidden completely from the System Status view (Hide Excluded).
These settings allow the status overview to be adapted to the requirements of a specific system without disabling the underlying status monitoring.
Each individual status entry provides access to its history. Click the history icon next to a status to open the Status History dialog. The dialog lists previous state changes together with their timestamp, status type, event message, and any available details. It also identifies the corresponding originator, section, and component.
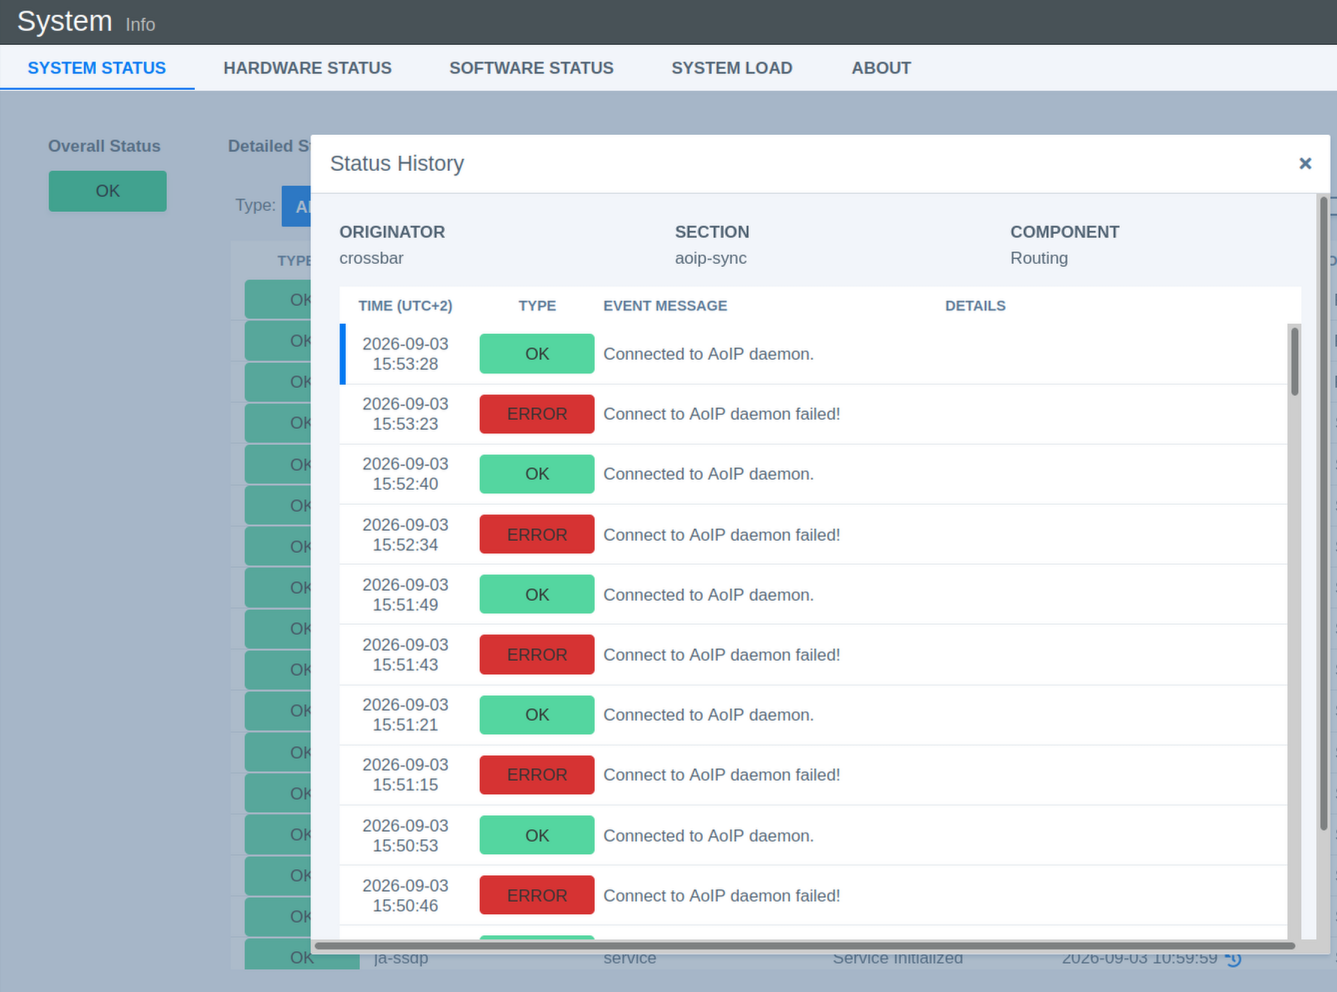
This history can be useful when investigating intermittent issues, as it allows you to see when a status changed and whether it subsequently returned to its normal state.
Diagnostics File
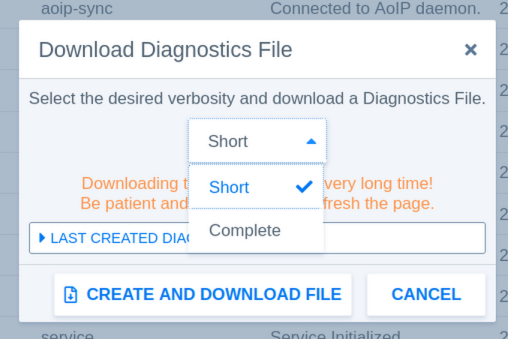
Click Diagnostics on the Info page to open the Download Diagnostics File dialog.
Select the desired level of detail:
- Short creates a smaller diagnostics file containing the information typically required for troubleshooting.
- Complete collects more extensive diagnostic information and may take considerably longer to create.
Click Create and Download File to generate and download the Diagnostics File. When creating a Complete file, keep the page open until the process has finished.
If a Diagnostics File has already been created, information about the most recently created file is also available in the dialog.
Hardware Status
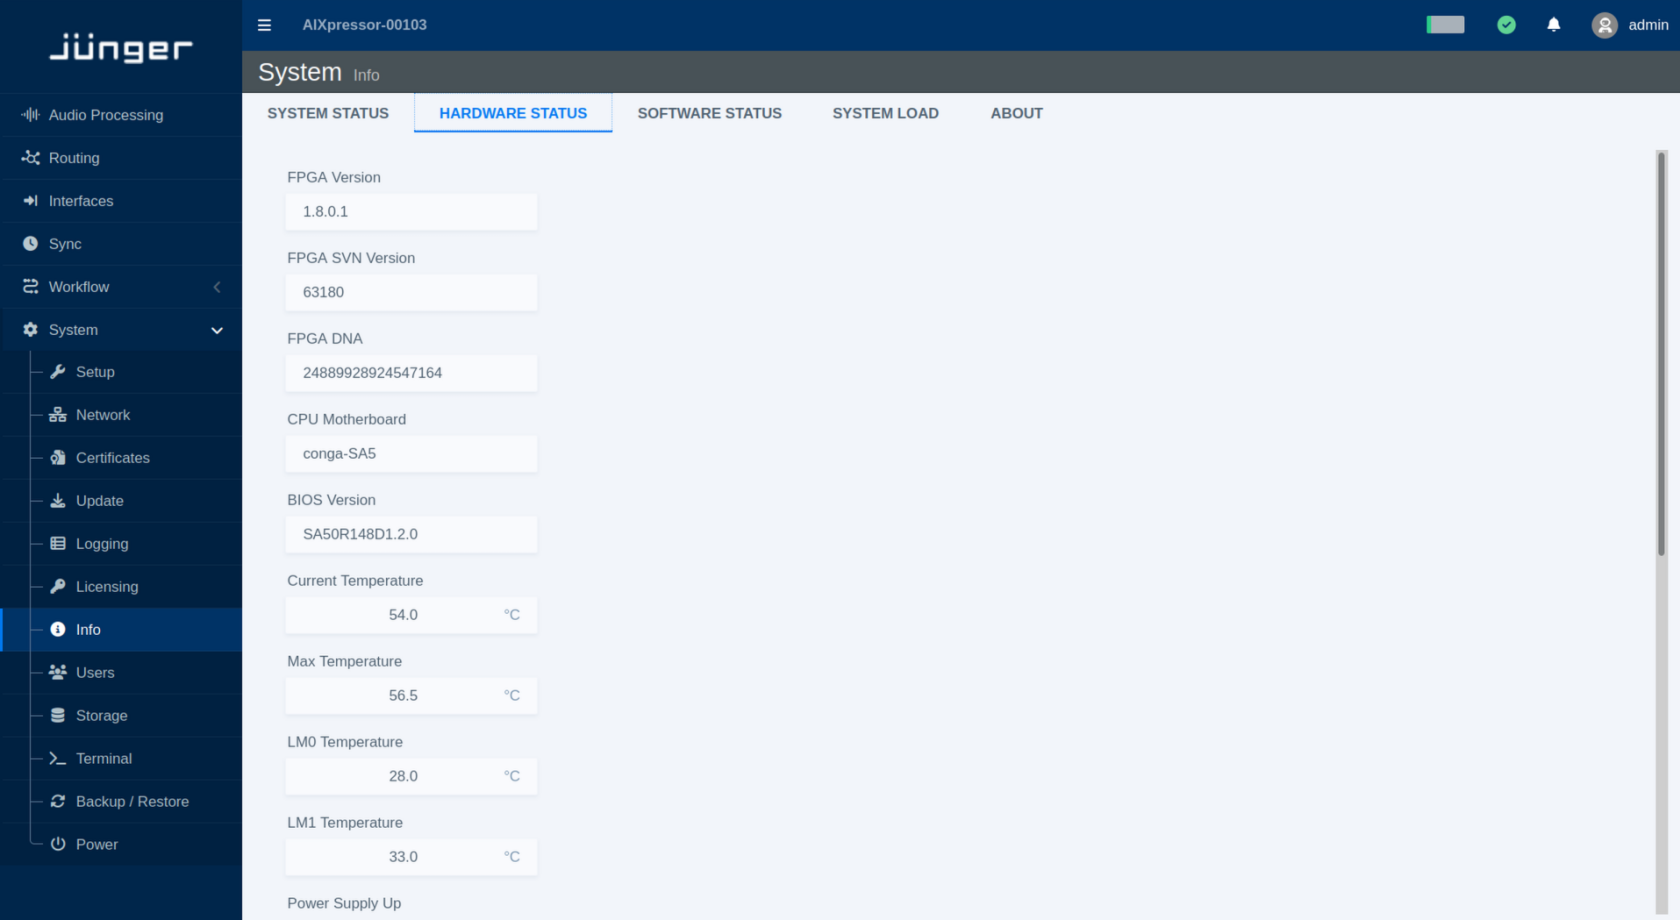
The Hardware Status section provides detailed information about the hardware components of the flexAI system. It is primarily intended for diagnostics and service purposes.
Depending on the system, the displayed information may include firmware versions, temperatures, fan status, and power supply status.
Software Status
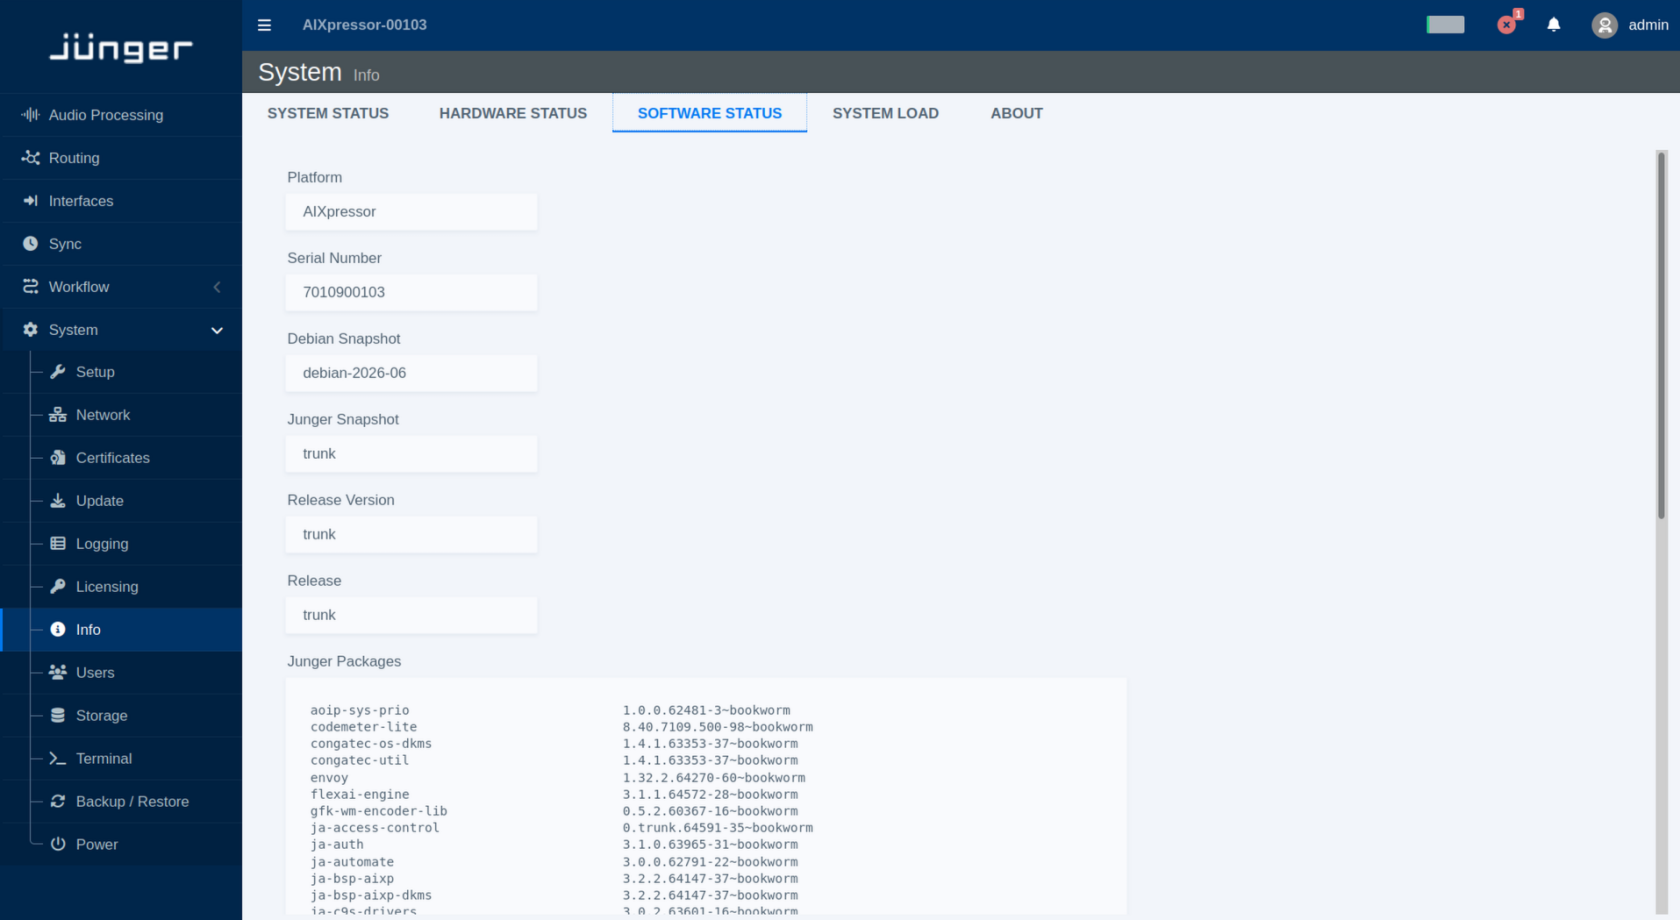
The Software Status section lists information about the software components and versions currently installed on the flexAI system.
System Load
The System Load section provides an overview of the current processing load of the flexAI system.
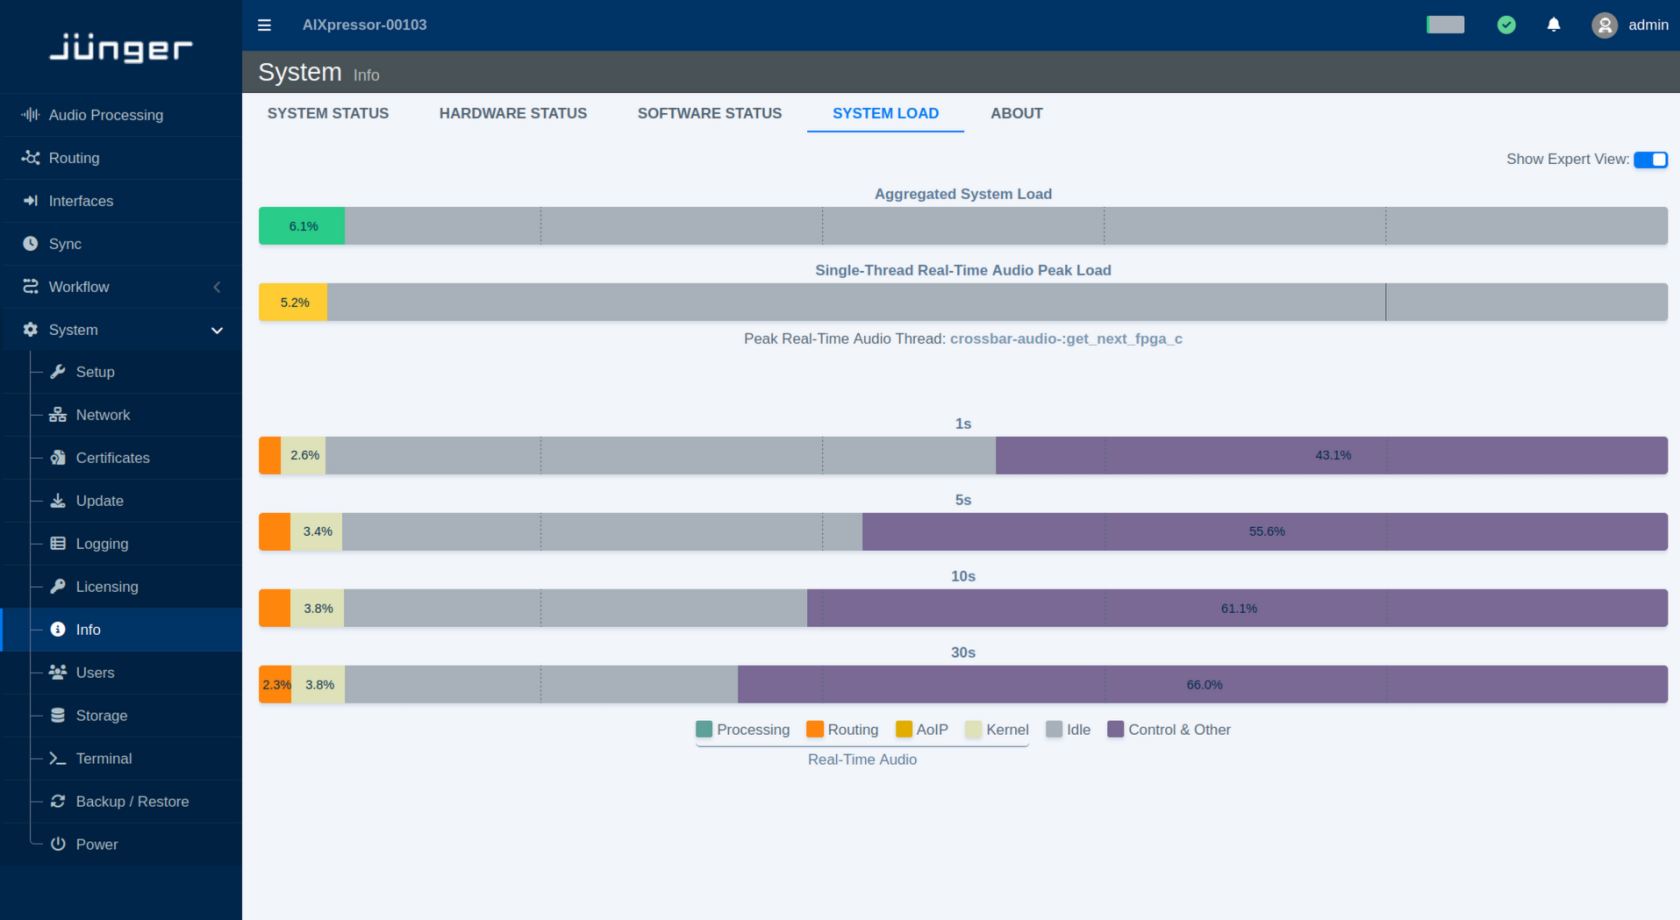
Aggregated System Load shows the overall system load and provides a quick indication of the available processing capacity.
Enable Show Expert View to display more detailed load information. The Single-Thread Real-Time Audio Peak Load shows the peak load of an individual real-time audio processing thread.
The Expert view also provides four system load bars with integration times of 1 s, 5 s, 10 s, and 30 s. Each bar is divided into color-coded sections showing how the system load is distributed across the following functions:
-
Processing
-
Routing
-
AoIP
-
Kernel
-
Real-Time Audio
-
Idle
-
Control & Other
The different integration times provide views of the system load over different time periods. Shorter integration times make brief changes in load more visible, while longer integration times provide a more stable view of the overall load distribution.